3 Easy Steps to Enable Statistics on Moodle
Statistics and reporting is not enabled on Moodle by default. It is probably a good thing as for big sites with a big user population, the process of logging and generating the statistic can overwhelm the server. But once it gets over the ‘hump’, you will appreciate the reporting the Statistics can deliver.
If you can’t see the report and statistical graphs or table on Moodle, that’s because you haven’t enabled the feature. Once enabled, and with a little patience, Moodle will generate graphs and tables of user activity and courses.
3 Easy Steps to Enable Statistics on Moodle
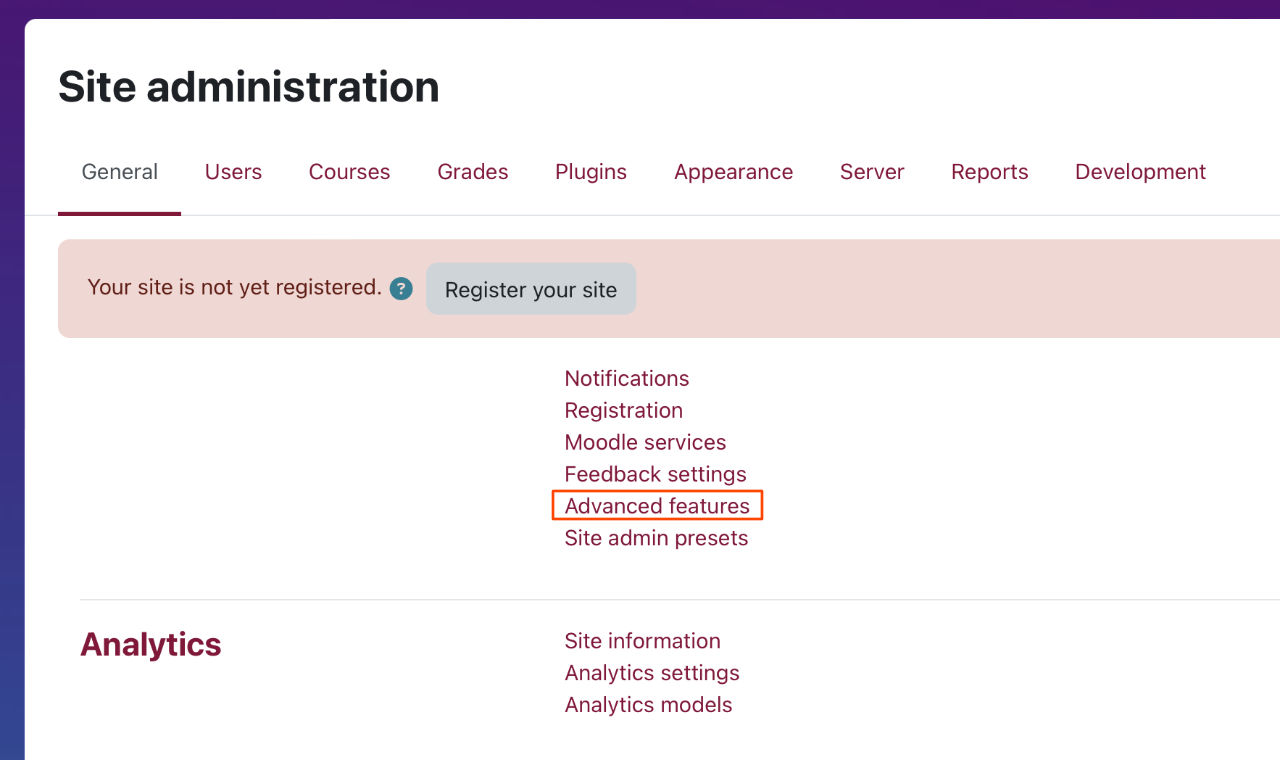
Login as administrator or an account with administrative access then:
- Go to Site administration > General: Advanced features (from the first list) see screenshot above.
- Scroll down to Enable statistics and tick the checkbox, then scroll down to the bottom and click Save changes button.
- For the settings, go to Administration > Site administration > Server > Statistics (if you don’t see this, go back to step 1 and 2 and make sure you have the enable statistics checkbox ticked). There you will find the settings for Statistics
Settings for Statistics
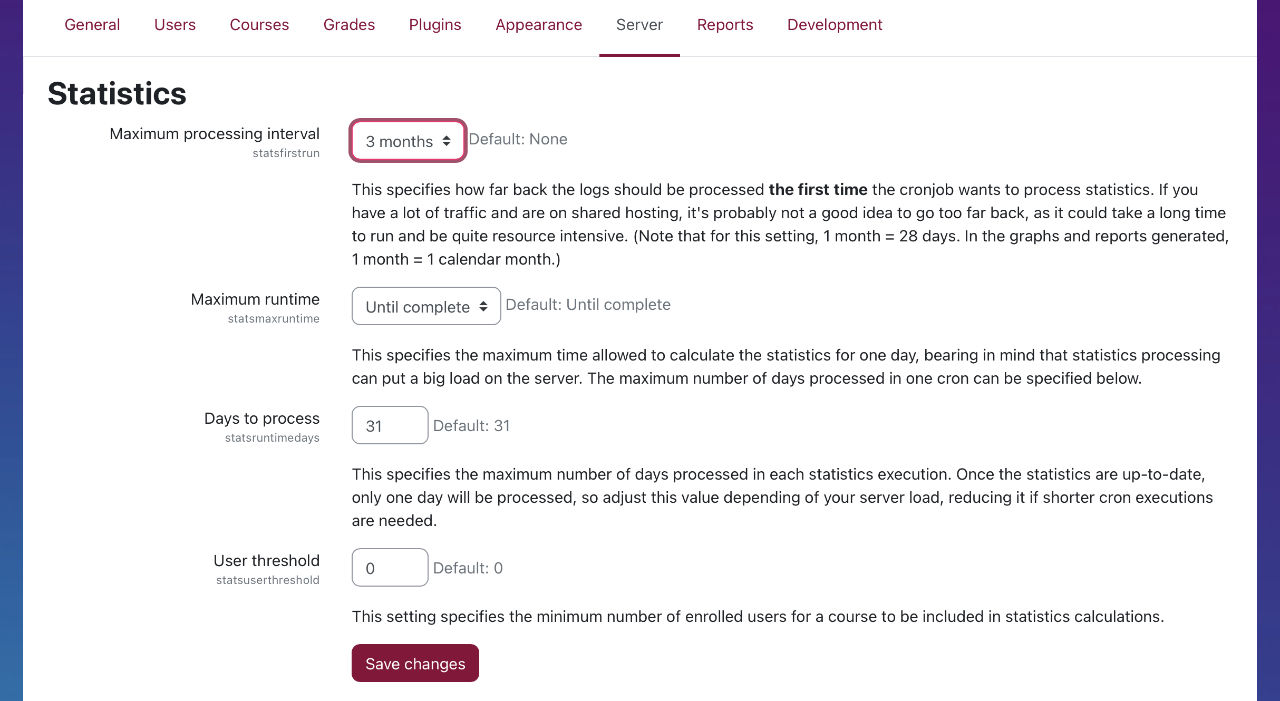
Go to Administration > Site administration > Server > Stastistics. There is no real need to change the settings here to begin with although I have changed the Maximum processing interval to just 1 month or even 1 week to speed things up. I then change this to 3 months, 6 months and eventually to none.
Basically, this decides the amount of data that needs to be processed for the first time the cronjob process the statistics. The duration set here specifies how far back you wish to process the logs.
If you have a lot of traffic and/or are on a shared hosting server, keep this duration short otherwise it could take a long time to run. Plus, running these processing tasks can be quite resource intensive. 1 month=28 days.
Use this setting in conjunction with Days to process. This specifies the maximum number of days to process for each statistics execution. The default is set to 31. When you get over the huge back log or hump, and the statistics are up to date, it will only have one days worth of log to process.
How long do I have to wait?
Now, that you have enabled Statistics on Moodle, you need to wait. The wait time can be days but don’t give up. Moodle’s cronjob (the heart beat that kicks in to process scheduled task) is required to process the logs and gather the statistics. If you haven’t got this running, make sure you set it up. The Statistic cronjob is scheduled once a day at midnight. However, depending on the amount of traffic on the site, the processing can take a long time. Tweak the settings, Maximum processing internal and Days to process in the previous section to speed things up.
Force Statistics Cron Task to Run
WARNING: The following steps require access to the database. Make sure you have a backup before attempting to change the database.
To run stats manually, go to the database, go to the mdl_config table and set statslastdaily, statslastweekly and statslastmonthly to 0 (leave statslastmonthly alone if you think it might be large logtables causing the problem).
Then go to Administration > Site administration > Server > Scheduled tasks and look for the task “Background processing for statistics”; set this to be a minute or two into the future by adjusting the hour and minute values.
If you manually run cron, you should see output there showing that stats are processing, but be patient if it appears to hang – this can take between 5 mins and several hours depending on how big your site is, so just leave it going.
Afterwards, you might want to return the Scheduled task’s values back to asterisks so that it returns to the defined schedule.
To limit the length of time logs are kept to reduce the size of the tablets, Go to Site administration > Plugins > Logging > Standard log.
Where are the Reports: Graphs and Tables?
Now that you have enabled Statistics on Moodle, you may be eager to look for those graphs and tables you heard so much about. We just have to warn you that the first scheduled cron task for Statistics only runs at midnight so you won’t see this. And, depending on the size of the logs and setting we discussed earlier, the first run might be split into a few nights so don’t worry if you haven’t got any data even after a few days to a week. See steps below to access the data as:
View Reports as Administrator
For administrators, login and head over to Site Administration > Reports > Course overview (under Reports)

From the Report Type > choose one of four options
- Most active courses
- Most active courses (weighted)
- Most participatory courses (enrolments)
- Most participatory courses (poss/views)
Set the Time period – last (pick from pop-up options) then click View
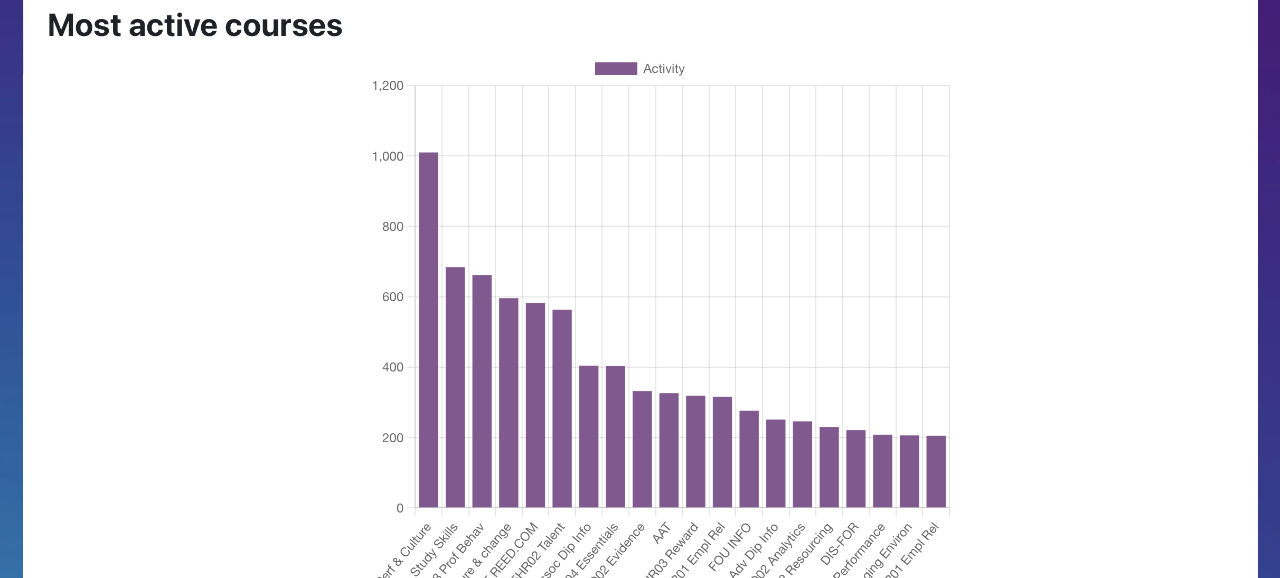
If you can’t see the report or options to generate the graph, do not worry. It takes time to process the logs. This can be days or even weeks.
View Reports as Teacher, Manager or Non-editing Teacher
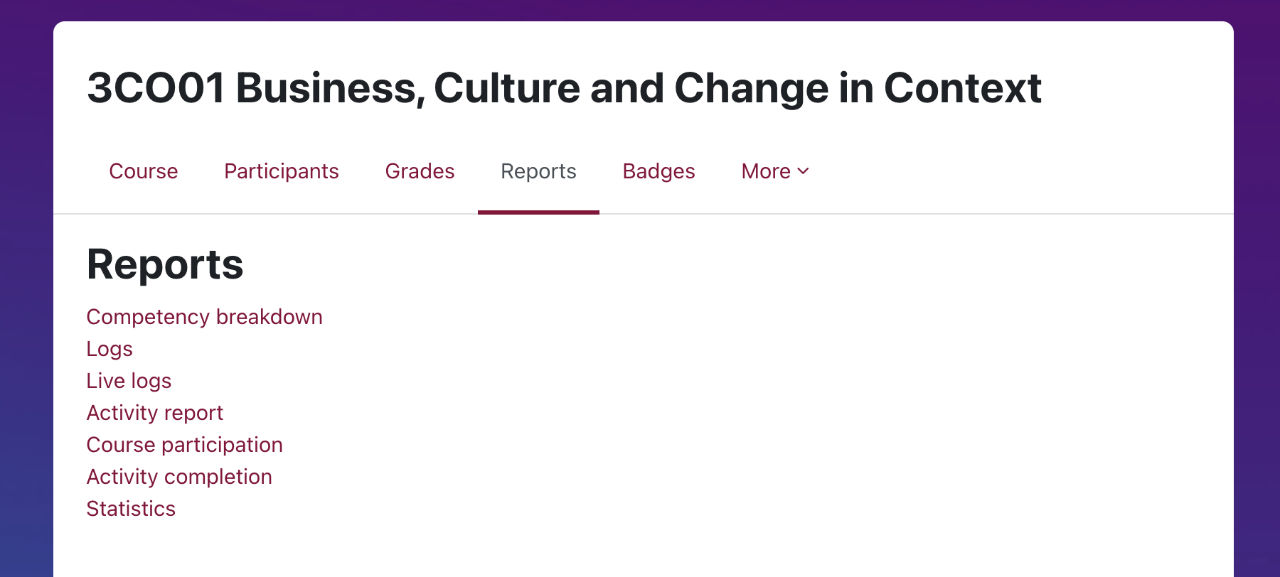
For everyone else, excluding the students, you can access the report using the following steps:
- Login as staff (teacher, manager, non-editing teacher)
- Go to a Course page
- In the top menu bar for the course click on Reports then Statistics (see screenshot above)
- From the Report type choose from one of the five options (see screenshot below), pick Time period – last: and then click View
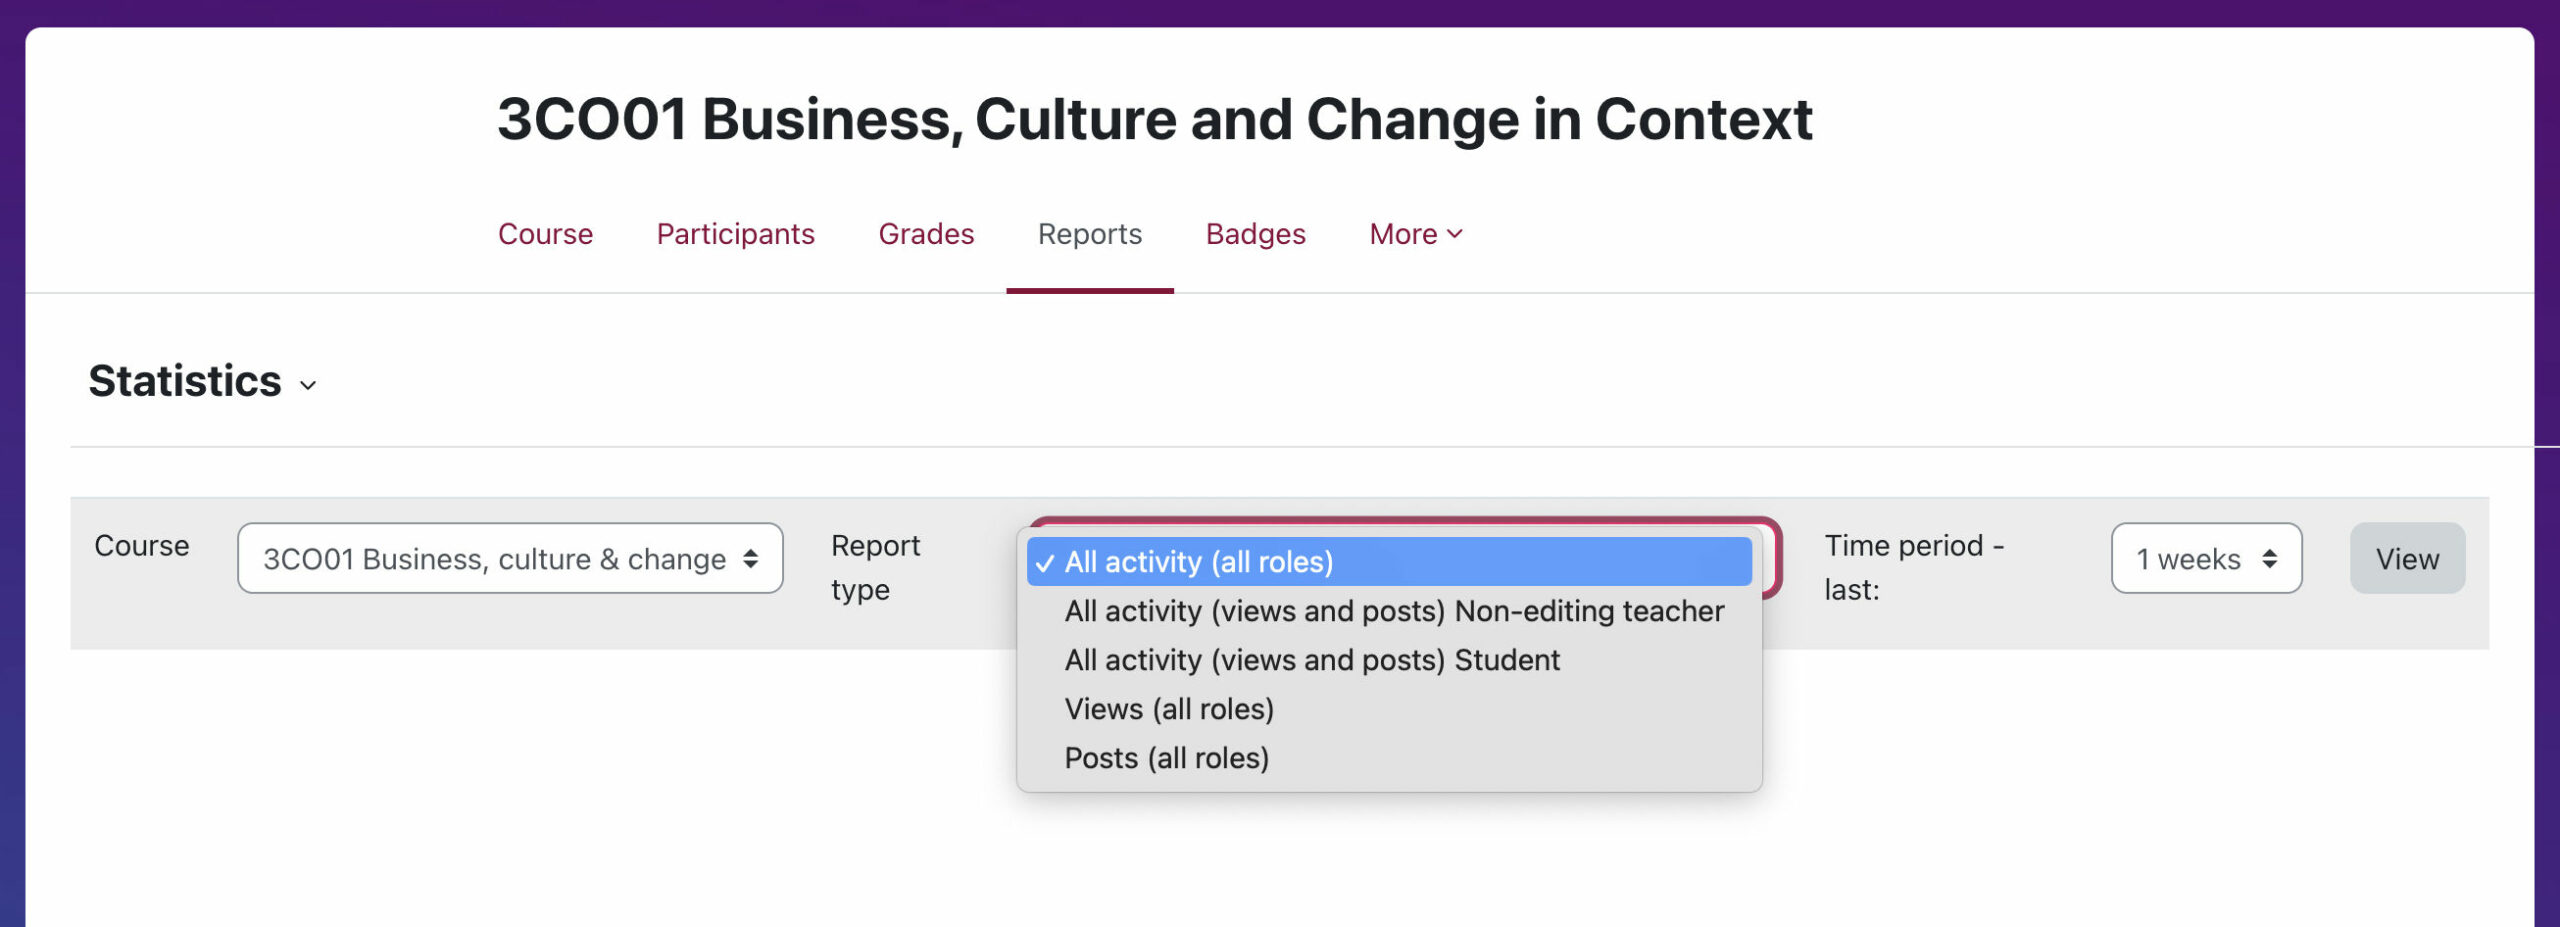
Now enjoy your graph. You can always change the Report type and time period from the drop down menus then click View to update the graph.
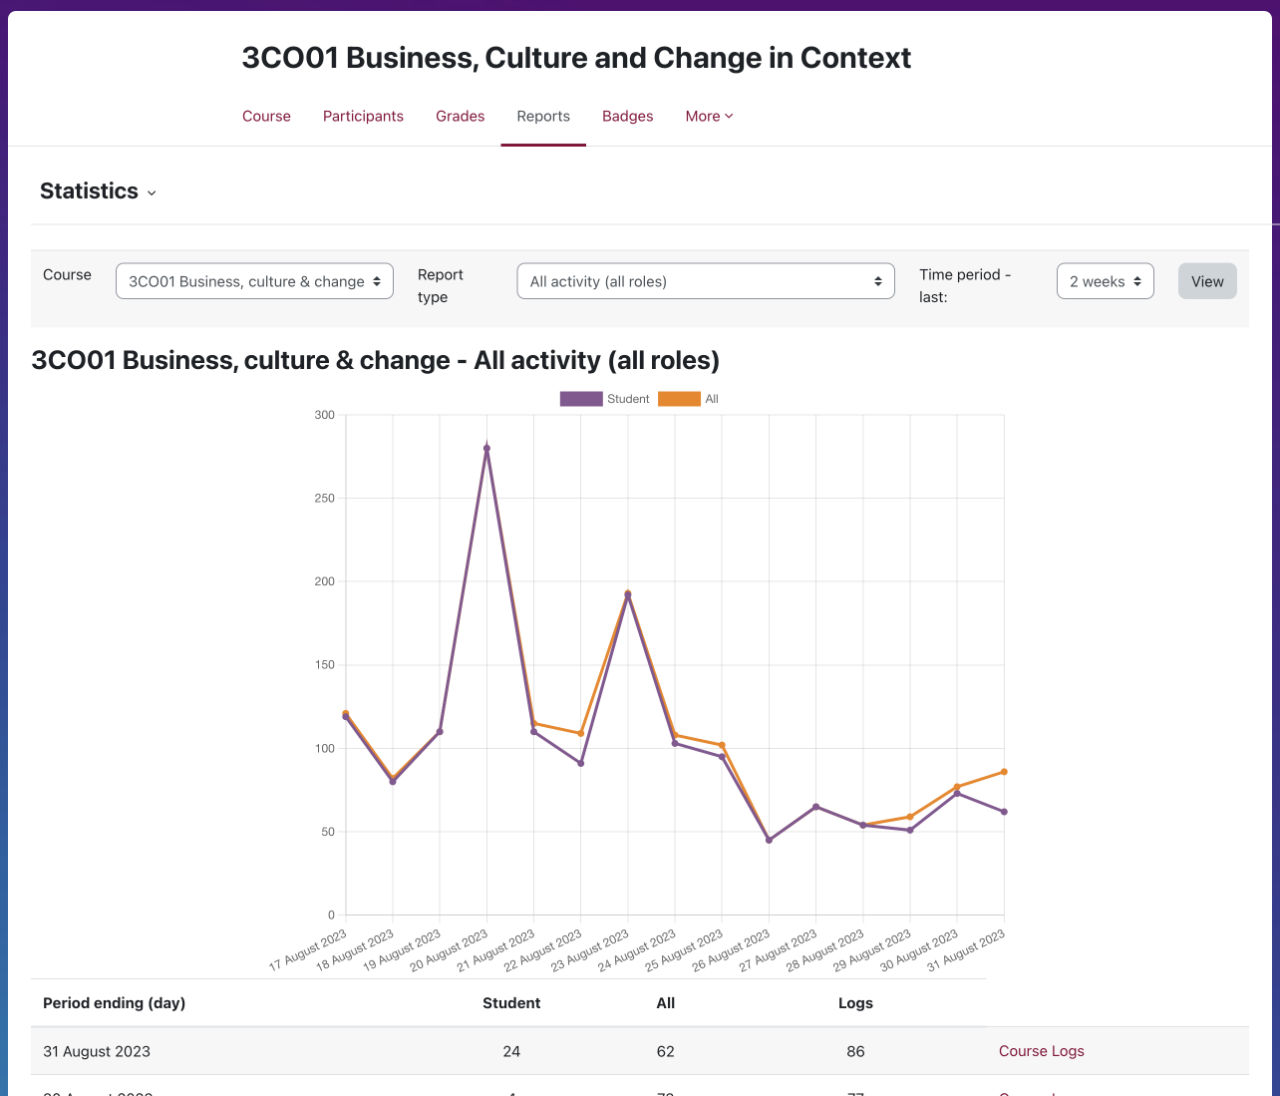
The table under the graph shows day to day statistics. You can click on the link “Course Logs” to the right to view a list of activity.


